Powerful Insights for Southeastern States
Posted on June 14, 2023
In this era of data-driven decision-making, having access to accurate and up-to-date information is crucial. Recognizing this need, we at Shupe Carboni and Associates are thrilled to announce the launch of our new Data page, designed to provide valuable insights and analytics specific to the southeastern states. With a focus on three key tabs—Weather, Housing, and PPI (Producer Price Index)—our data page is a one-stop resource for tracking trends and understanding crucial factors that shape the region we service.
The Weather Tab: Daily Updates on Cooling Degree Days
When it comes to understanding climate and its impact on various sectors, the Weather tab on our Data page is a game-changer. Through the National Weather Services, we are able to offer daily updates on cooling degree days for the southeastern states. Cooling degree days are a measurement used to estimate the energy needed to cool a building, and they provide insights into energy consumption patterns, particularly in relation to air conditioning.
By offering this information on a state-by-state basis, our Data page empowers you to make informed decisions for demand forecasting and resource allocation. Understanding cooling degree days can be invaluable for optimizing operations, managing costs, and planning for the future.
The Housing Tab: A Comprehensive View of the Real Estate Market
The housing market is a key driver of economic growth and a reflection of consumer sentiment. Our Housing tab on the Data page offers a comprehensive view of the real estate landscape in the southeastern states. We provide data on single-family permits issued, allowing you to gauge the level of construction activity and track trends over time.
Additionally, we incorporate two commonly cited indicators used by industry economists—the 12/12 and 3/12 percentage change. These measures compare the current permit issuance rates with the corresponding periods from the previous year, offering valuable insights into the growth or contraction of the housing market. By monitoring these indicators, you can assess the overall health of the real estate sector and make informed decisions regarding investments, expansions, or adjustments to business strategies.
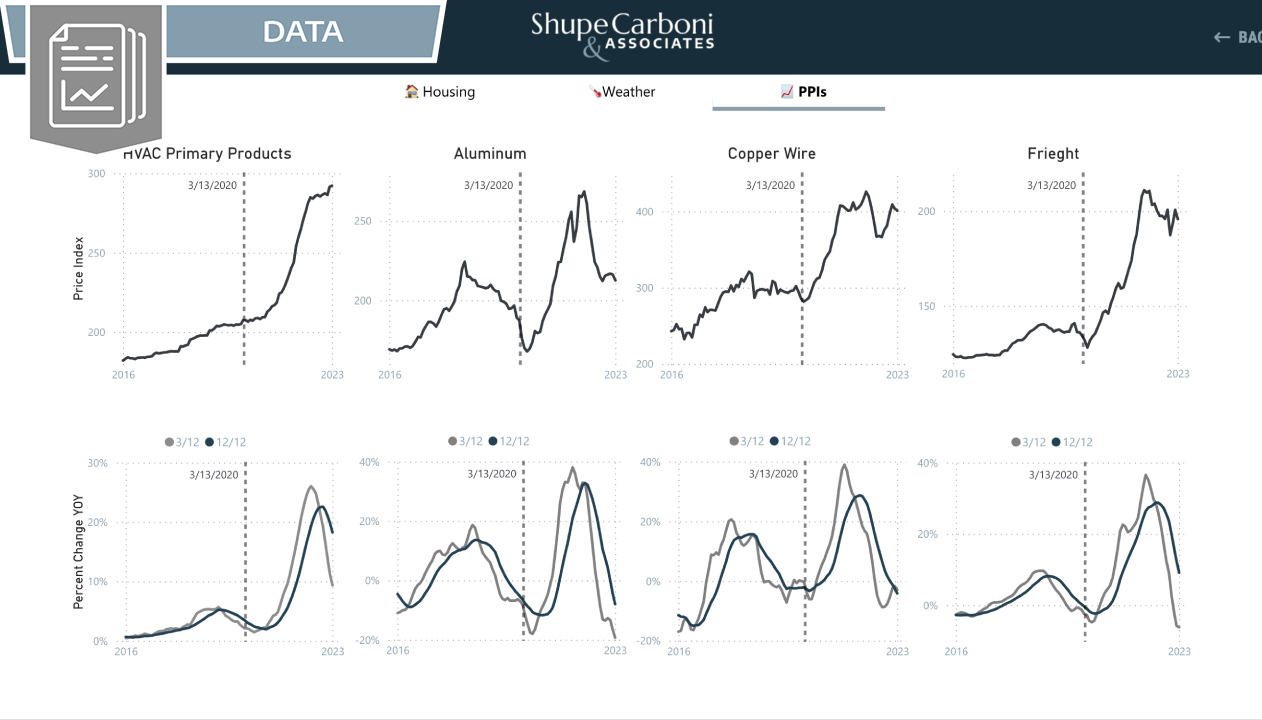
The PPI Tab: A Bird's-eye View of Input Costs and Trends
Cost fluctuations are an inevitable part of doing business, and having visibility into these changes can help businesses navigate economic shifts effectively. Our PPI tab on the Data page provides valuable insights into input costs through the lens of the Producer Price Index (PPI). The PPI measures the average change over time in the selling prices received by domestic producers for their output.
By examining the PPI trends for each sector, you can gain a birds-eye view of input costs, allowing for more accurate budgeting, pricing strategies, and risk management. Our PPI tab equips you with the necessary tools to stay ahead of market dynamics and make data-driven decisions.
Empower Your Decision-Making with Data from Shupe Carboni and Associates
In today's rapidly evolving economic landscape, data is the key to staying competitive and making informed decisions. With our new Data page, we provide you with a wealth of information at your fingertips. The Weather tab offers daily updates on cooling degree days, the Housing tab provides insights into the real estate market, and the PPI tab grants you a comprehensive view of input costs and trends.
Armed with these powerful tools, you can navigate the complex world of data, uncover meaningful patterns, and leverage insights to your advantage. Our new data page is here to empower you on your journey toward success.