Enhancements to Shupe Carboni's Data Presentation
Since we established our Data page on the Shupe Carboni & Associates website approximately one year ago, we have continually reviewed how we present certain data points to ensure the highest clarity. We have recently made a slight change in how we present data on our Weather tab in the Data section of our website. We've updated the format to offer a clearer perspective, the cumulative differences by state over the prior year.
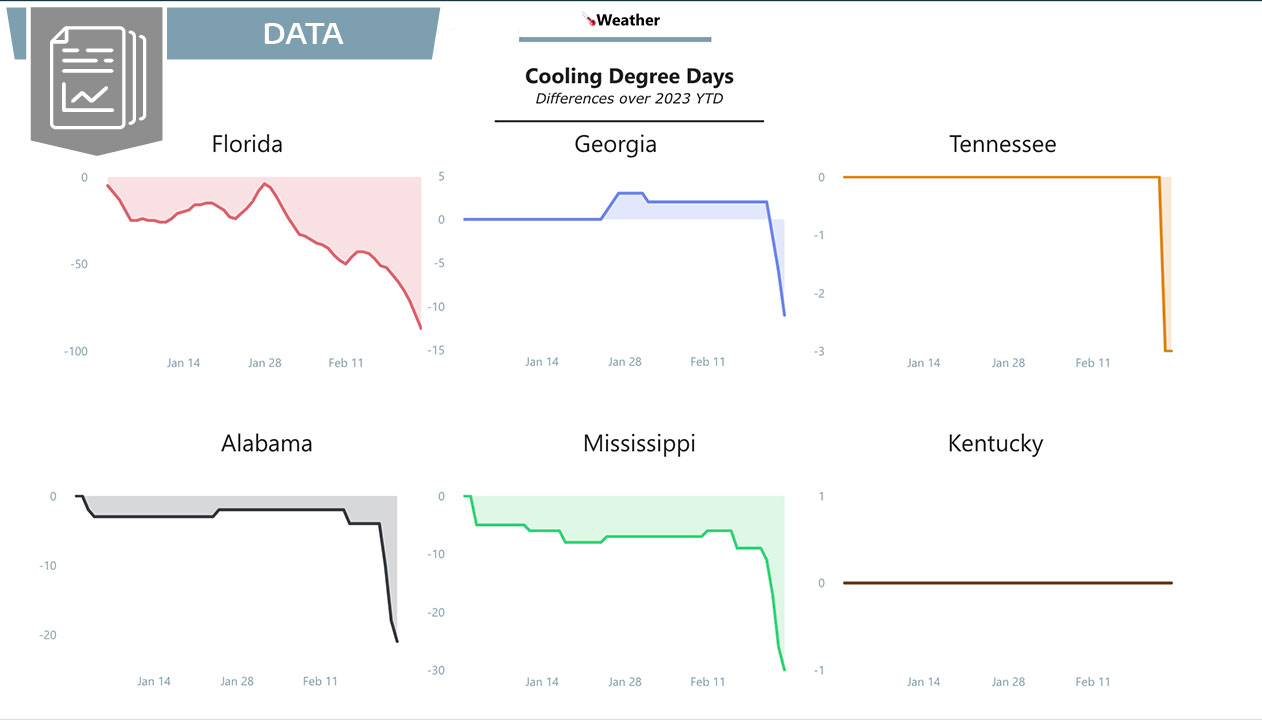
Previously, our data page showcased cumulative Cooling Degree Days (CDDs) and a separate line for "normal" cumulative values. However, with this update, we've streamlined the presentation to provide a single line representing the variance between the current year (2024) and the previous year (2023) Year-To-Date (YTD).
Here's a quick breakdown of how to interpret the new presentation:
If the line is below zero, it indicates that this year has been cooler compared to the previous year. Conversely, if the line is above zero, it suggests that this year has been warmer compared to the previous year. We want to emphasize that this change doesn't include cold weather considerations (Heating Degree Days). For days below 65 degrees Fahrenheit, the CDD value remains zero.
We appreciate your ongoing support and engagement with our data analysis. As always, we remain committed to delivering valuable and insightful information to our partners.
Thank you for your attention, and stay tuned for more updates.