Cooler than 2022 in the Southeast
Posted on December 28, 2023
In the August issue titled "Cool Summer for the Southeast," I examined the cumulative Cooling Degree Days for 2023 in comparison to a typical year. As we enter 2024, I would like to reevaluate the accumulated Cooling Degree Days, this time comparing the year end values to the values from 2022.
What are Cooling Degree Days?
Cooling Degree Days (CDDs) are a measurement used in climatology and building energy analysis to estimate the amount of energy required to cool a building or space. They are calculated by quantifying the number of degrees that a day's average temperature exceeds a baseline temperature, typically 65°F (18.3°C), which is considered the base or threshold temperature for indoor comfort in most climates. This calculation is performed daily and the cumulative value over a specified period, often a month or a season, is used to assess the demand for air conditioning or cooling requirements. The higher the value of cooling degree days, the greater the demand for cooling systems to maintain a comfortable indoor temperature.
The Southeast - Compared to 2022
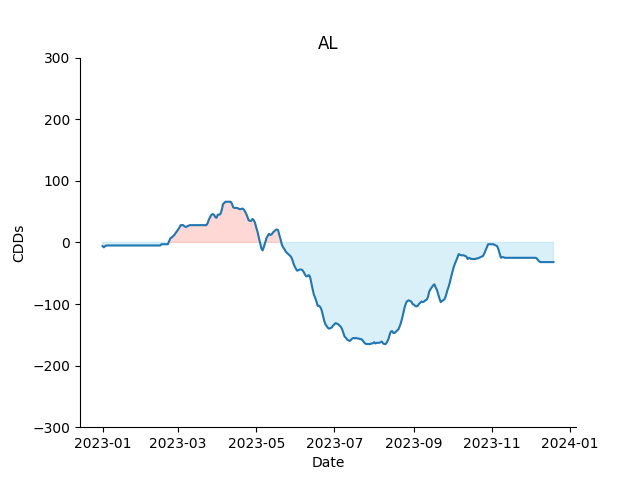
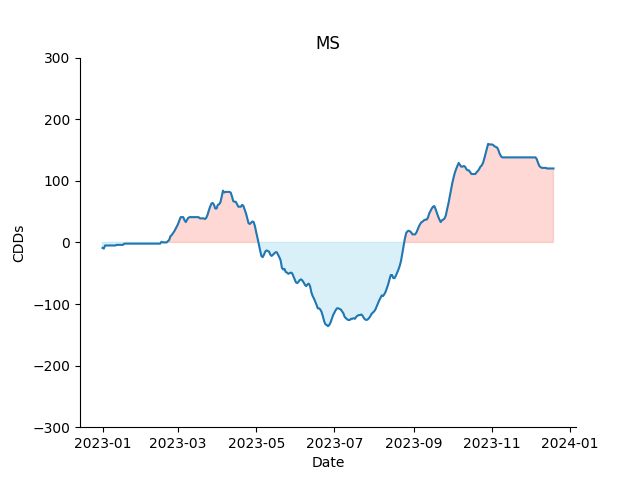
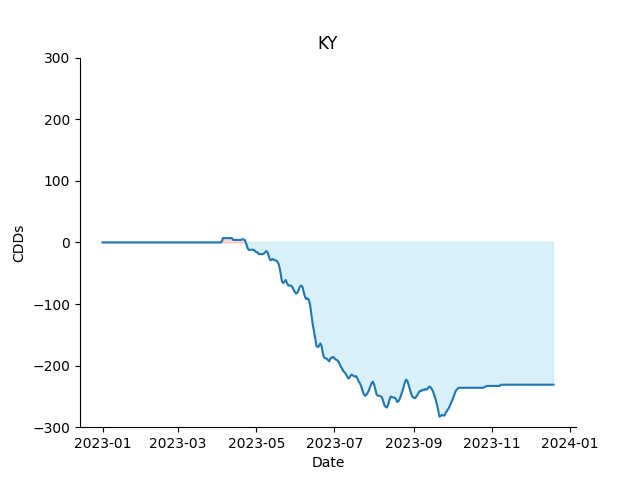
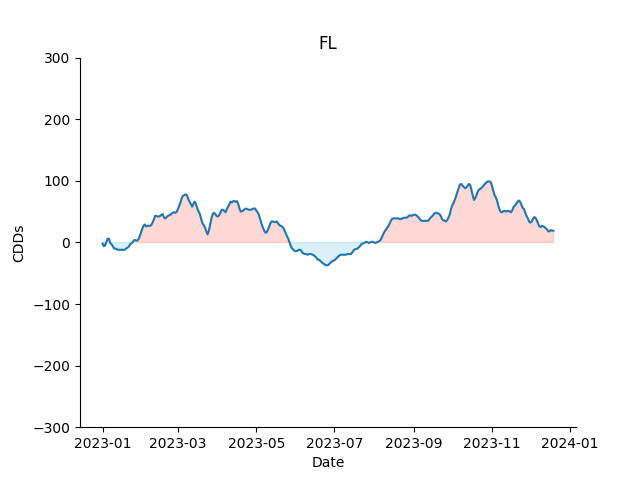
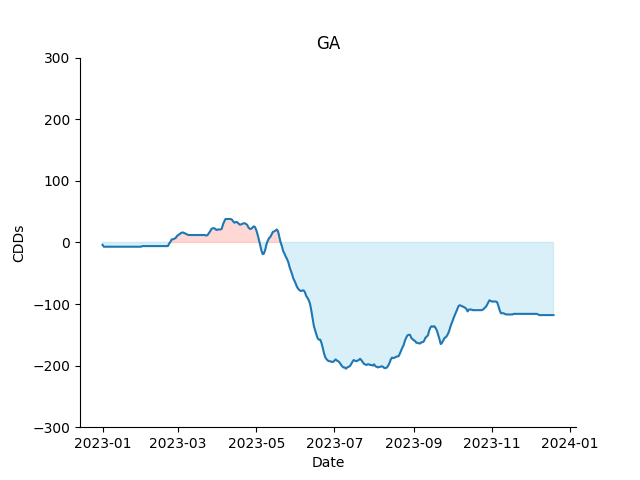
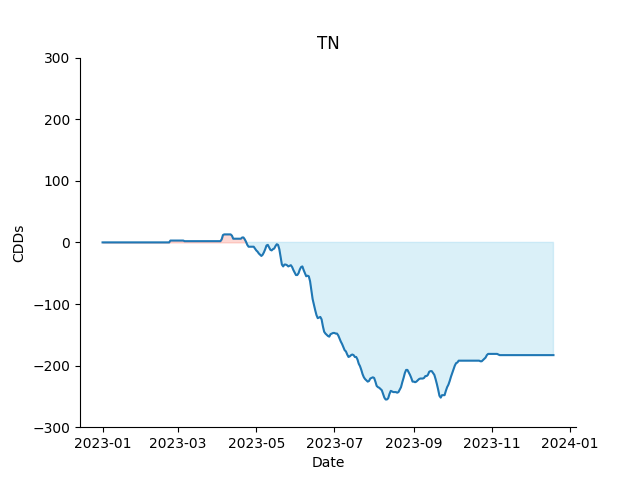
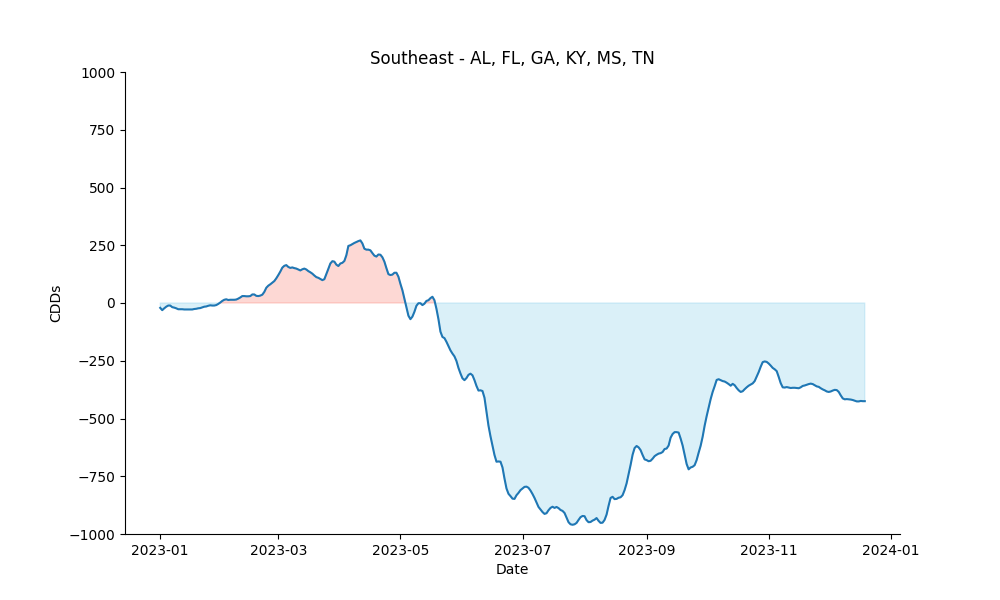
At Shupe Carboni, we look at Cooling Degree Days by state. In these graphs, we plot the difference between cumulative CDDs in 2023 vs. 2022 on each day throughout the year (left-to-right). Above zero, 2023 had been warmer overall up to that date, and below zero, 2022 had been warmer overall.
 |
 |
 |
|---|
 |
 |
 |
|---|
Florida was steady compared to the other states and a touch warmer this year. Georgia, Kentucky, Alabama, and Tennessee experienced a cooler overall year compared to 2022. Mississippi, on the other hand, ended the year warmer than 2022. Putting all of the states together as of December 19th, our region is down -424 CDDs compared to 2022. For context, the total number of CDDs as of December 19th, 2022 was 11,939, which means that the region is down -3.6%.
Takeaway
Boiling down comparisons to the baseline and considering the context of 2022, these outcomes are not unexpected. 2022 was approximately 3% over normal by this time of year, meaning a reversion was more likely than not. However, comparison to last year is important for contextualizing demand for cooling from year to year.
Joseph Carboni
Marketing, Operations & Technology Manager
Shupe Carboni & Associates